Satellite · raster
Vegetation health, computed live.
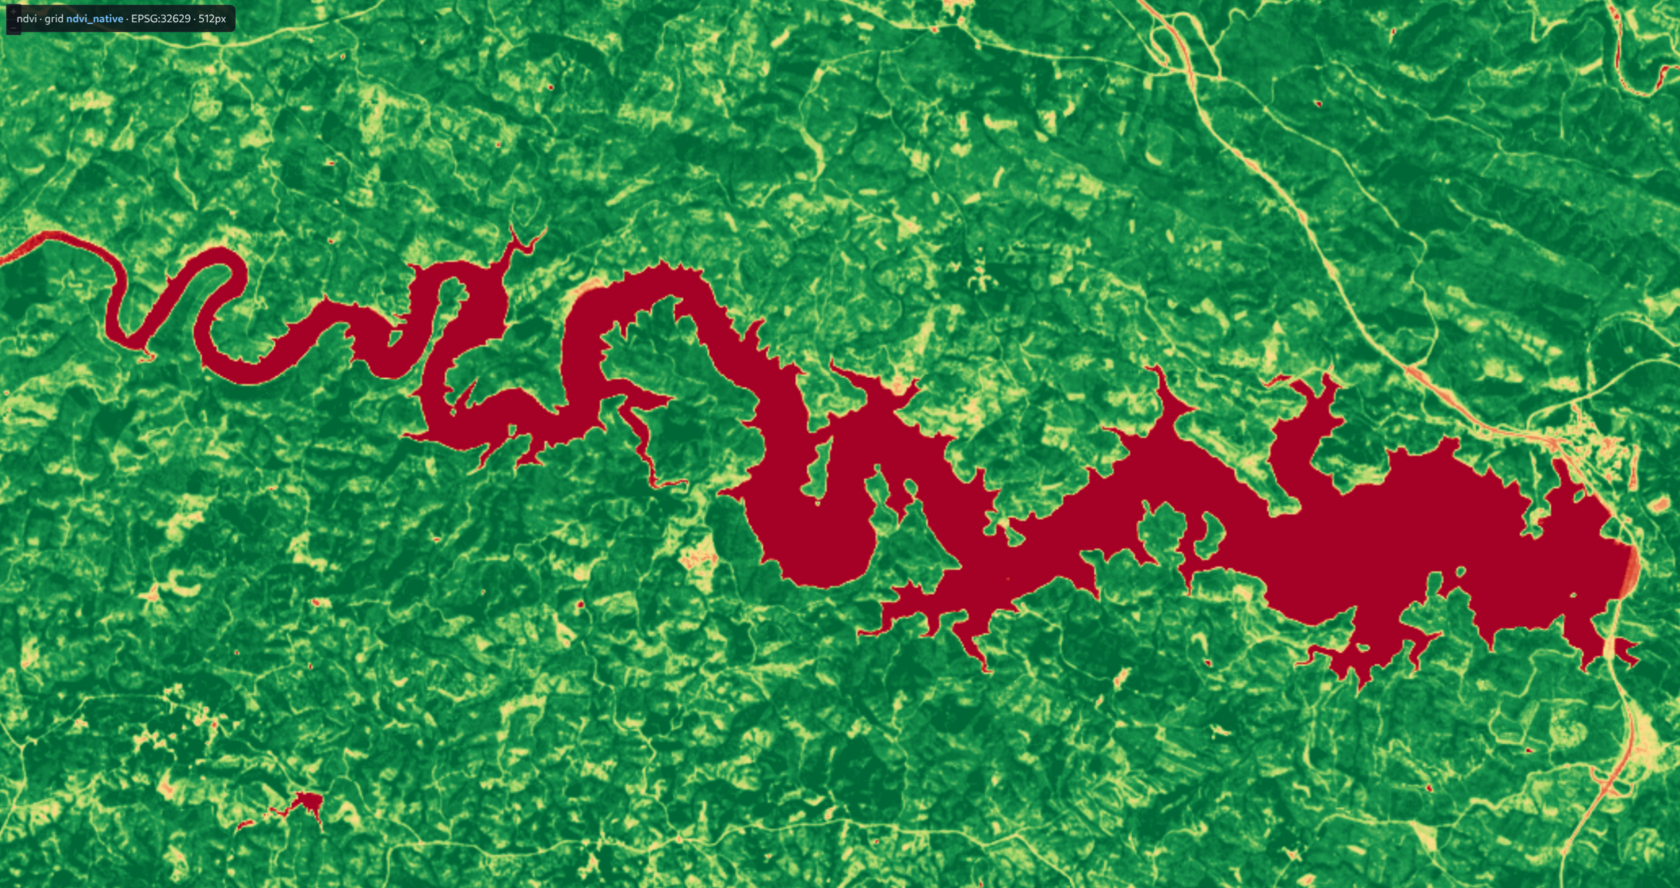
NDVI is the standard measure of how green and healthy plants are, worked out from satellite imagery. The usual way is to pre-compute a big NDVI image and store it. TerraServe doesn't store anything. It does the math for every tile, on the spot, straight from the raw satellite bands.
The approach
The math, per tile.
Near-infrared vs. red light
Healthy plants reflect a lot of near-infrared light and absorb red light. NDVI captures that in one number:
NDVI = (NIR − Red) / (NIR + Red)
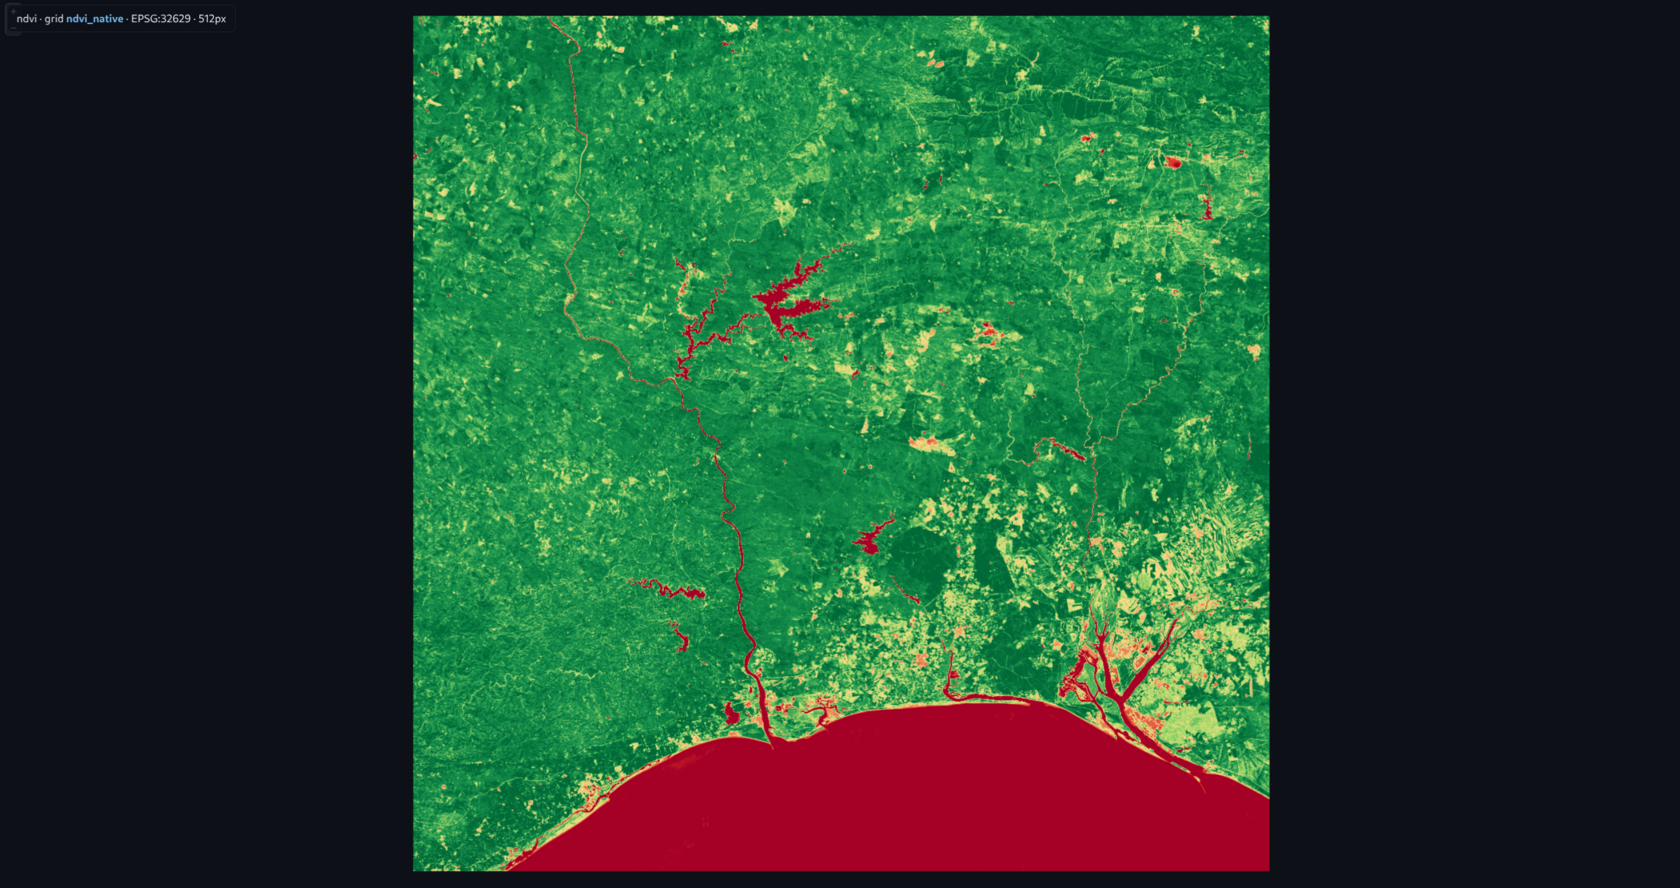
The satellite gives us the raw bands: B08 is near-infrared, B04 is red. TerraServe reads those two, does the division per pixel, and colours the result from brown (bare) to deep green (lush).
No pre-made image, no GDAL
Because the math is done on demand, there's no giant pre-derived NDVI file to build, store, or keep up to date, and you can change the formula (or the colours) by editing one line, with no re-processing. A full-extent render is 0.077 seconds at 4 MB of memory, reading straight from the original satellite file. No GDAL, no VRT, no intermediate steps.
How it's served
The exact command.
The real command behind the live demo. The one line that does the work is --expression.
terraserve serve # NDVI computed live from a Sentinel-2 image
  --cog /data/s2_stack.cog.tif  --style /data/ndvi.json  --src-crs EPSG:32629
  --expression "(B08 - B04) / (B08 + B04)"
  --bands B02,B03,B04,B08  --nodata=-32768  --name ndvi
  --cache-lru 1024  --wms-cache 512  --max-inflight 8
  --public-url https://terraserve.io/demo/ndvi/wms
| --cog | The data file: a Cloud-Optimized GeoTIFF holding several raw Sentinel-2 satellite bands stacked together. |
| --style | The colour ramp: how NDVI values (from −1 to +1) map to colours, brown through green. |
| --src-crs | The map projection the satellite image is in (UTM zone 29N, EPSG:32629, its native grid, kept as-is). |
| --expression | The heart of it. The formula run per pixel, per tile, on the fly. Change this one line and you change what the map shows. No re-processing. |
| --bands | Which raw bands the formula can use, and what to call them: B08 is near-infrared, B04 is red. |
| --nodata=-32768 | The value that means "no data here" (e.g. off the edge of the image), so it's left transparent. |
| --cache-lru 1024 | Remember decoded pieces of the satellite file (up to 1 GB). Unlike the vector demos, this one really uses it: it's the cache for raw image tiles. |
| --wms-cache 512 | Remember recently-drawn NDVI pictures so identical repeats are free. |
| --max-inflight 8 | Compute at most 8 tiles at once, one per core, keeping memory steady under load. |
| --public-url | The public address to advertise to GIS clients, since it runs behind a web proxy. |
Measured: a full-extent 900×900 render computes in 0.077 s at 4 MB of memory. The math runs straight from the raw bands, with the file's built-in overviews doing the heavy lifting when you're zoomed out. No pre-derived raster anywhere on disk.
Source. Sentinel-2 (Copernicus / ESA) imagery over the Algarve, southern Portugal: a stack of raw bands as a single Cloud-Optimized GeoTIFF.
In action
The colour ramp, up close.