Home -> Examples
Live demos
Seven real datasets. Seven different tricks.
Each demo pushes a different part of the engine: pre-baked tiles, windowed reads of a file too big to load, live math per request, vector tiles on a national grid most stacks can't touch, points for the whole world with labels close up, a live PostGIS database at continental scale, and (the odd one out) calling the engine straight from Python with no server at all. Open any card to see exactly how it's done, flag by flag, in plain English.
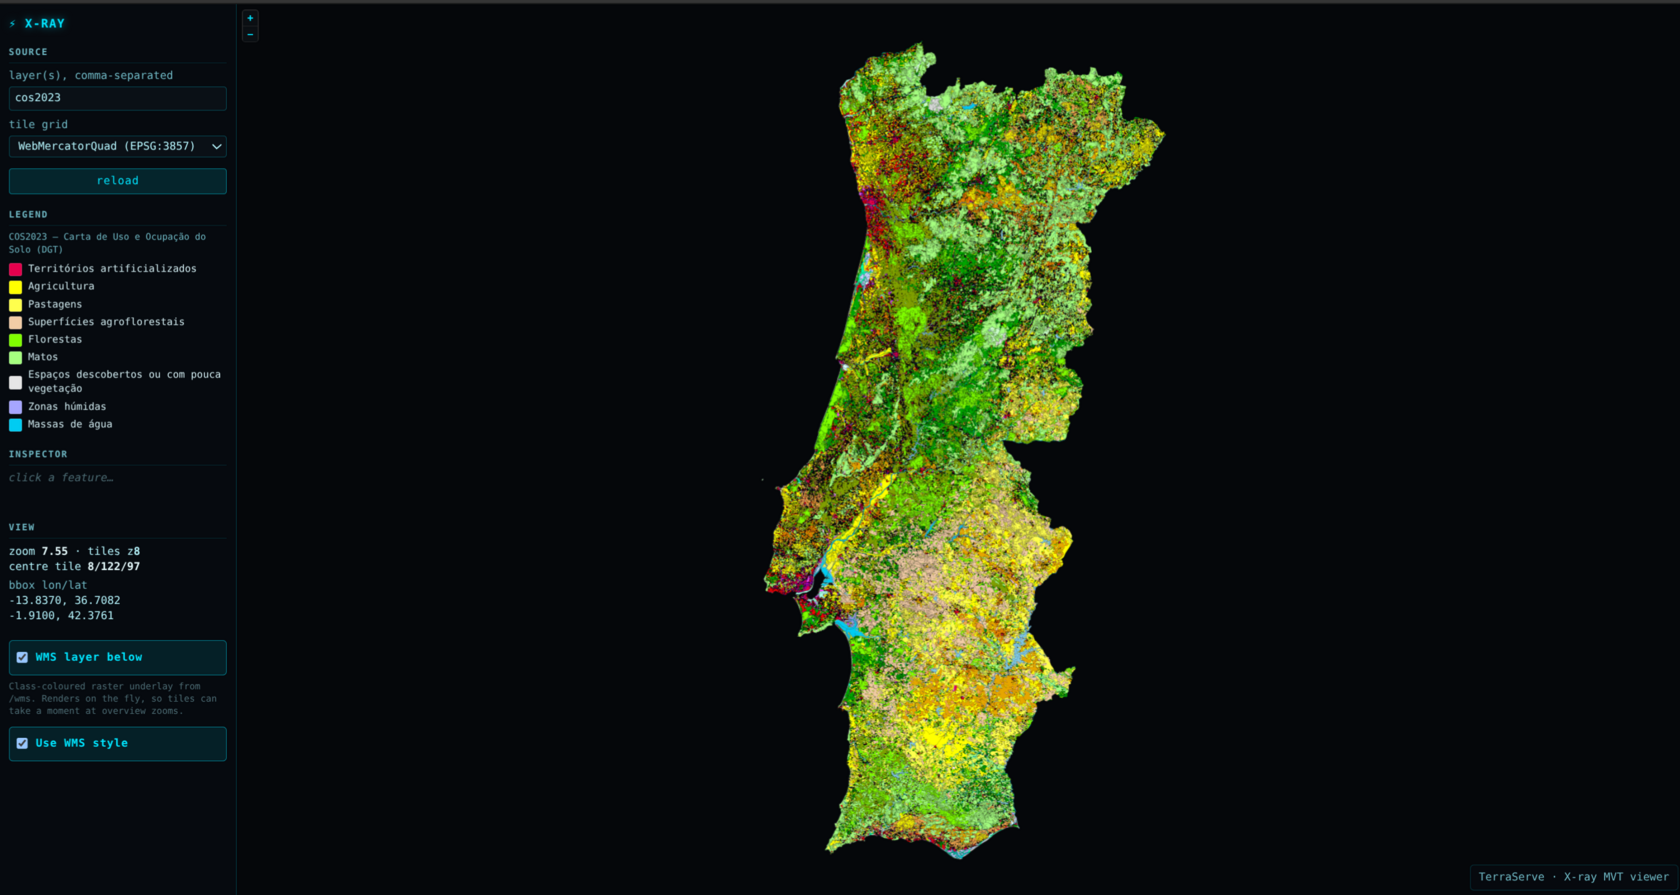
Portugal, mapped
The whole country's official land-cover map: 842,000 shapes, no gaps. Served as pictures for QGIS and as vector tiles for the browser, at once.
See how it works ->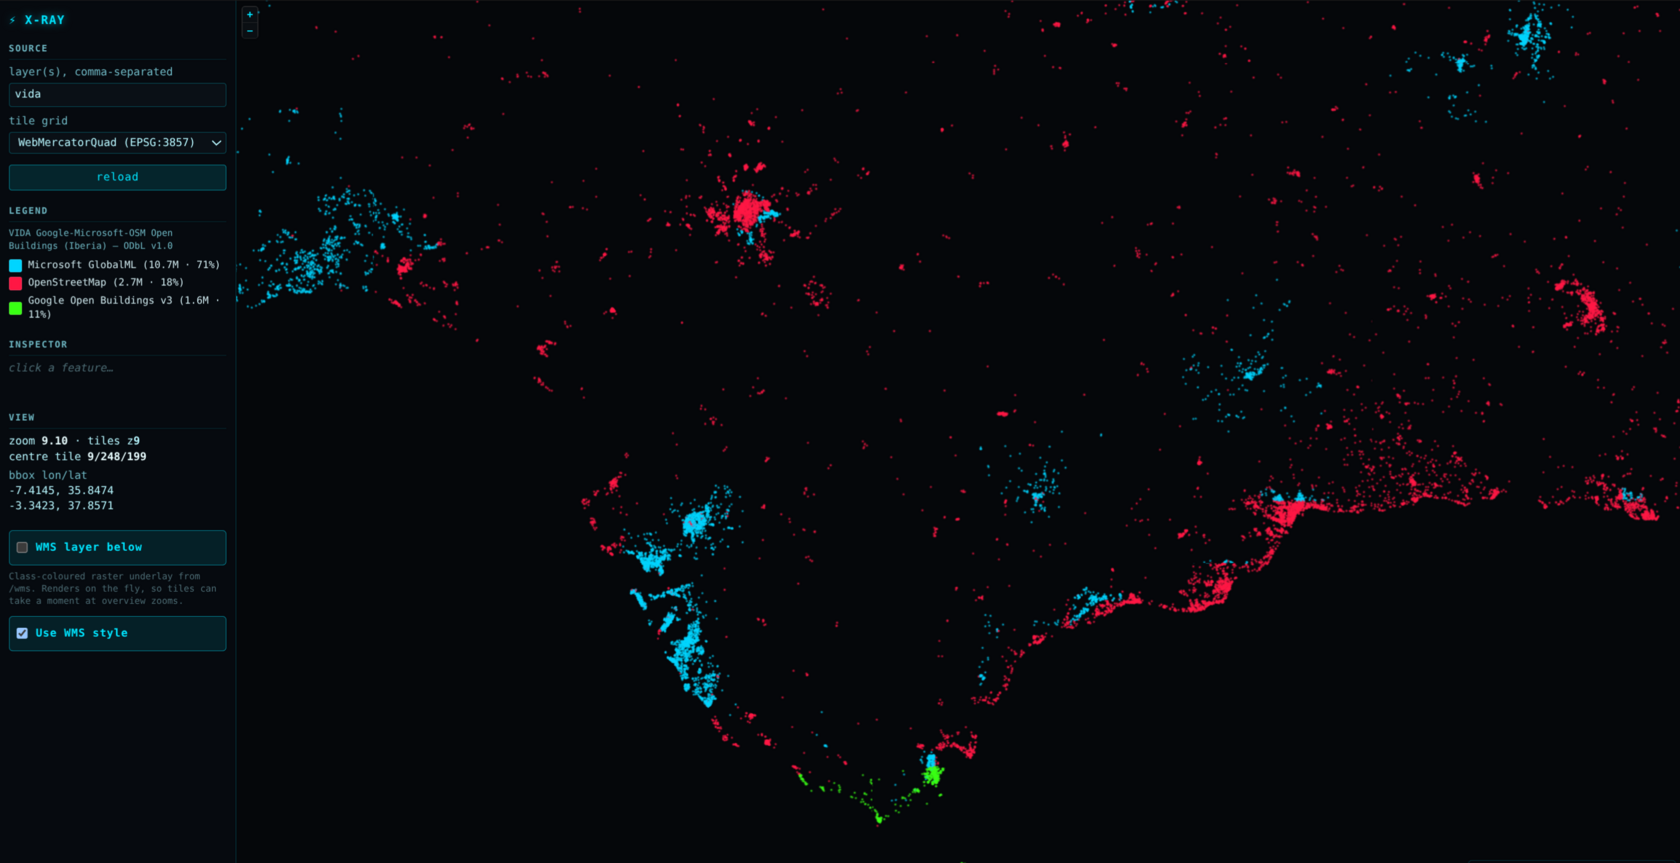
14.9 million buildings
Every building outline in Spain and Portugal. A 3.8 GB file that opens in 4 MB of memory, because it reads only what you're looking at.
See how it works ->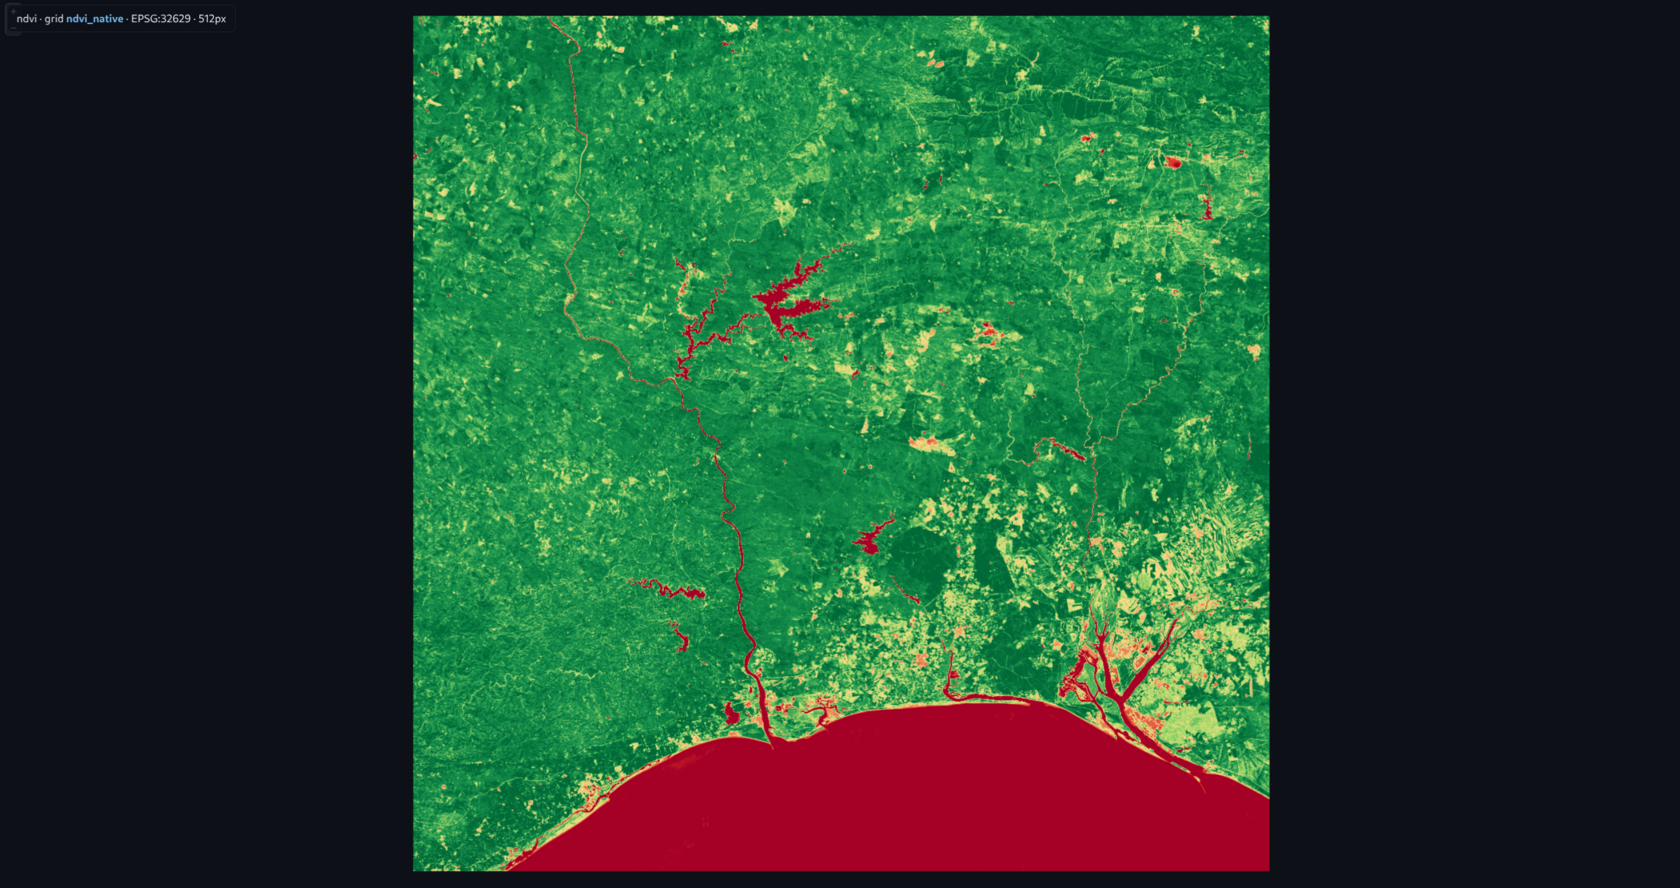
Vegetation, live
Plant health computed on the fly from raw Sentinel-2 satellite bands. No pre-made image, no GDAL. Just the math, per tile.
See how it works ->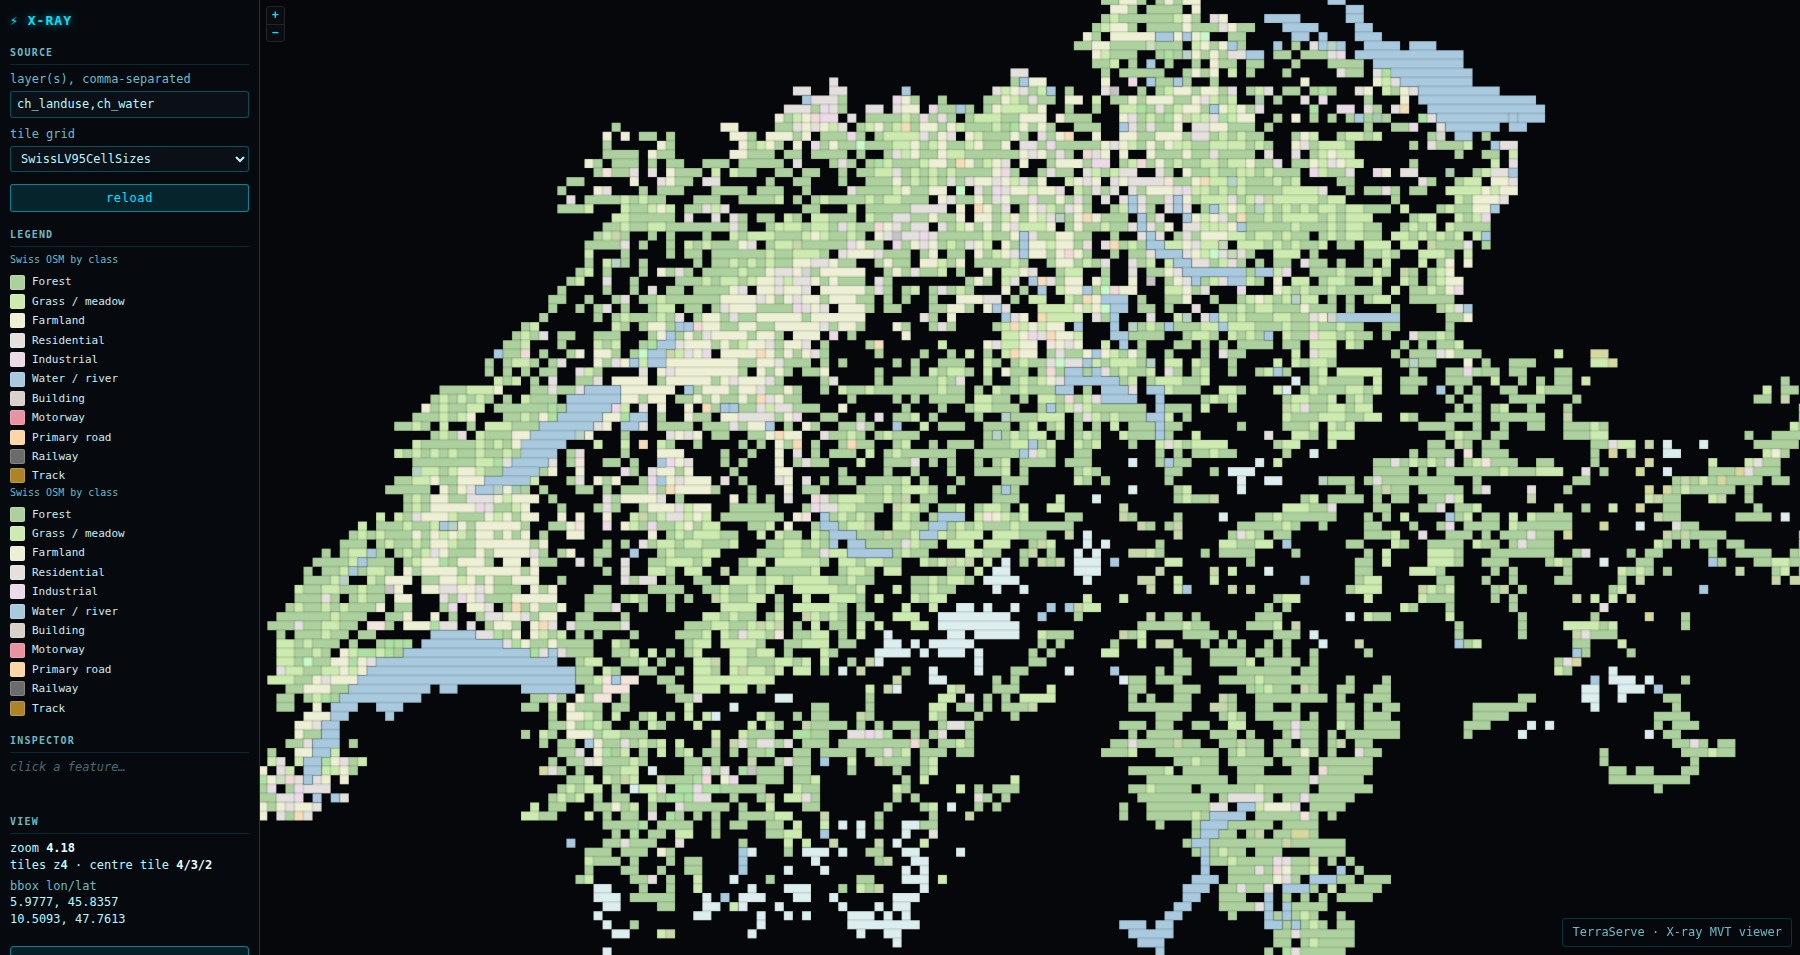
Switzerland, off with Web-Mercators
The same vector tiles served on the Swiss national grid, not Web Mercator, and precomputed on it. Also our most honest demo: watch a whole country fight a browser's memory, and see what we traded to win.
See how it works ->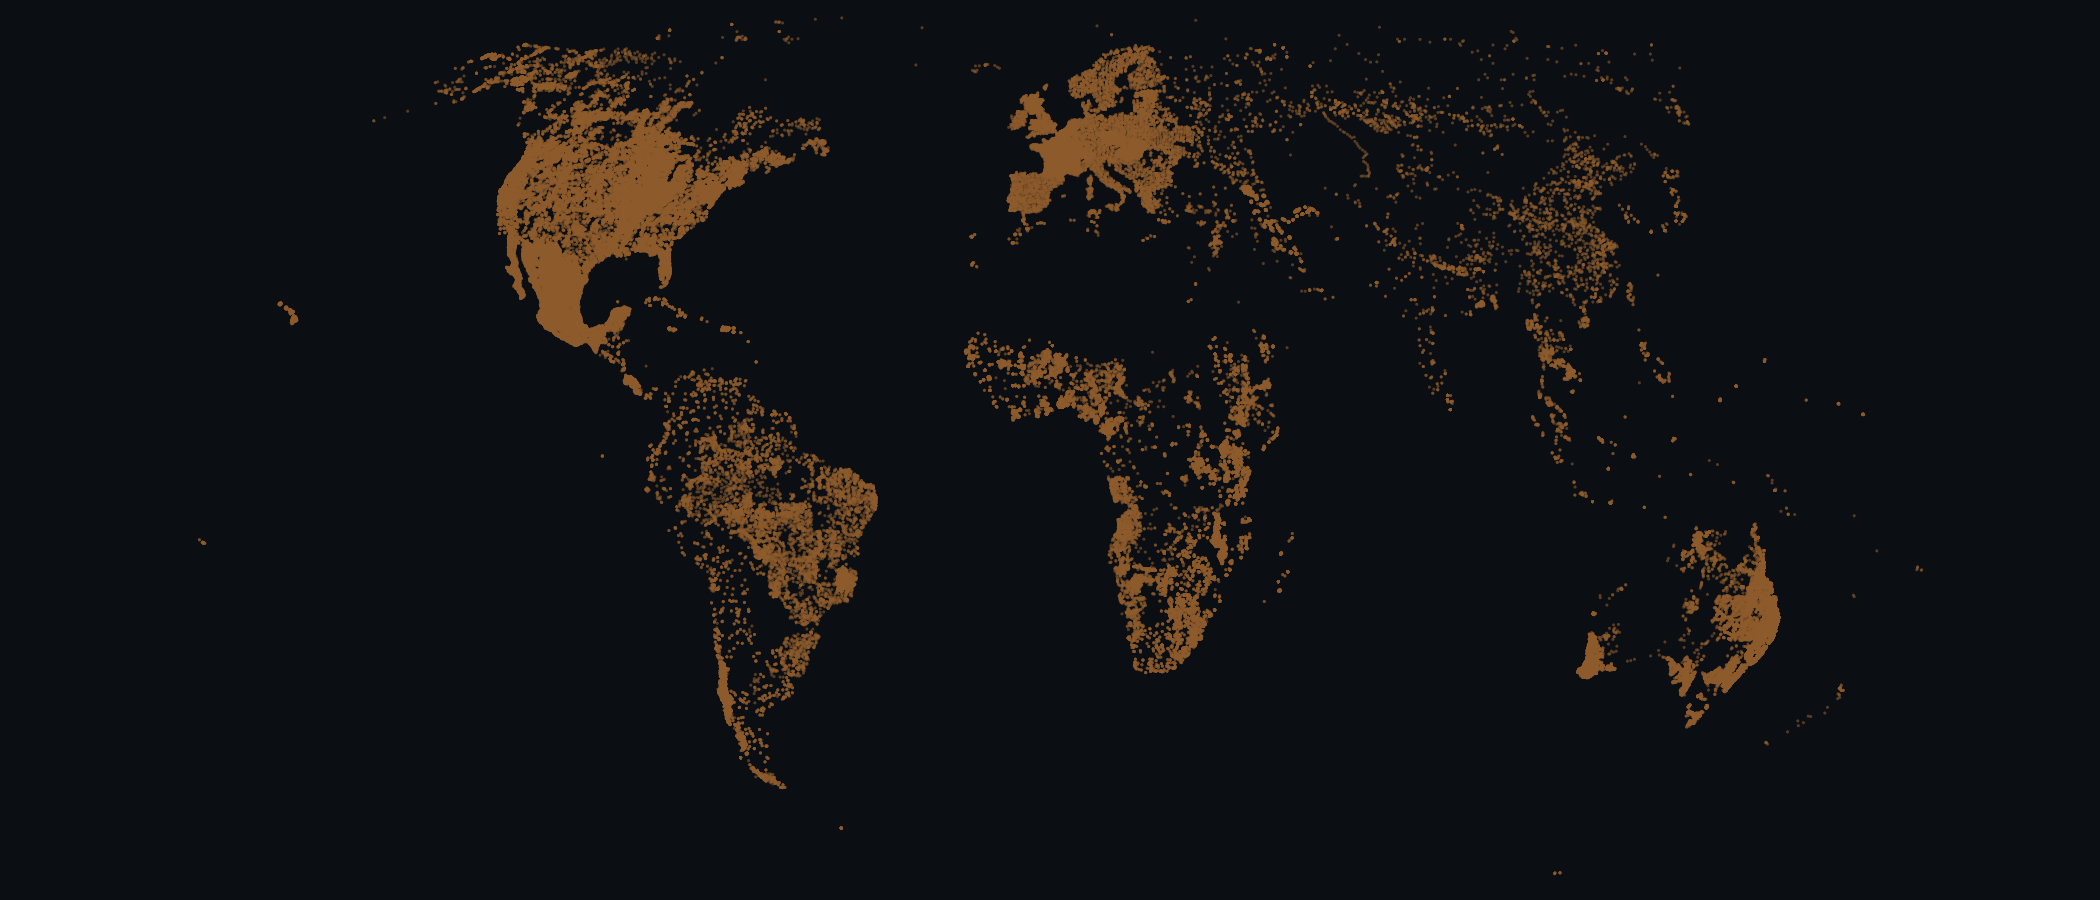
228,090 soil profiles
Where the world's soil profiles were dug and described: ISRIC's WoSIS, one dot each, from a 35 MB file, on an equal-area Equal Earth grid. Drawn live at every zoom, with profile numbers close up over WMS.
See how it works ->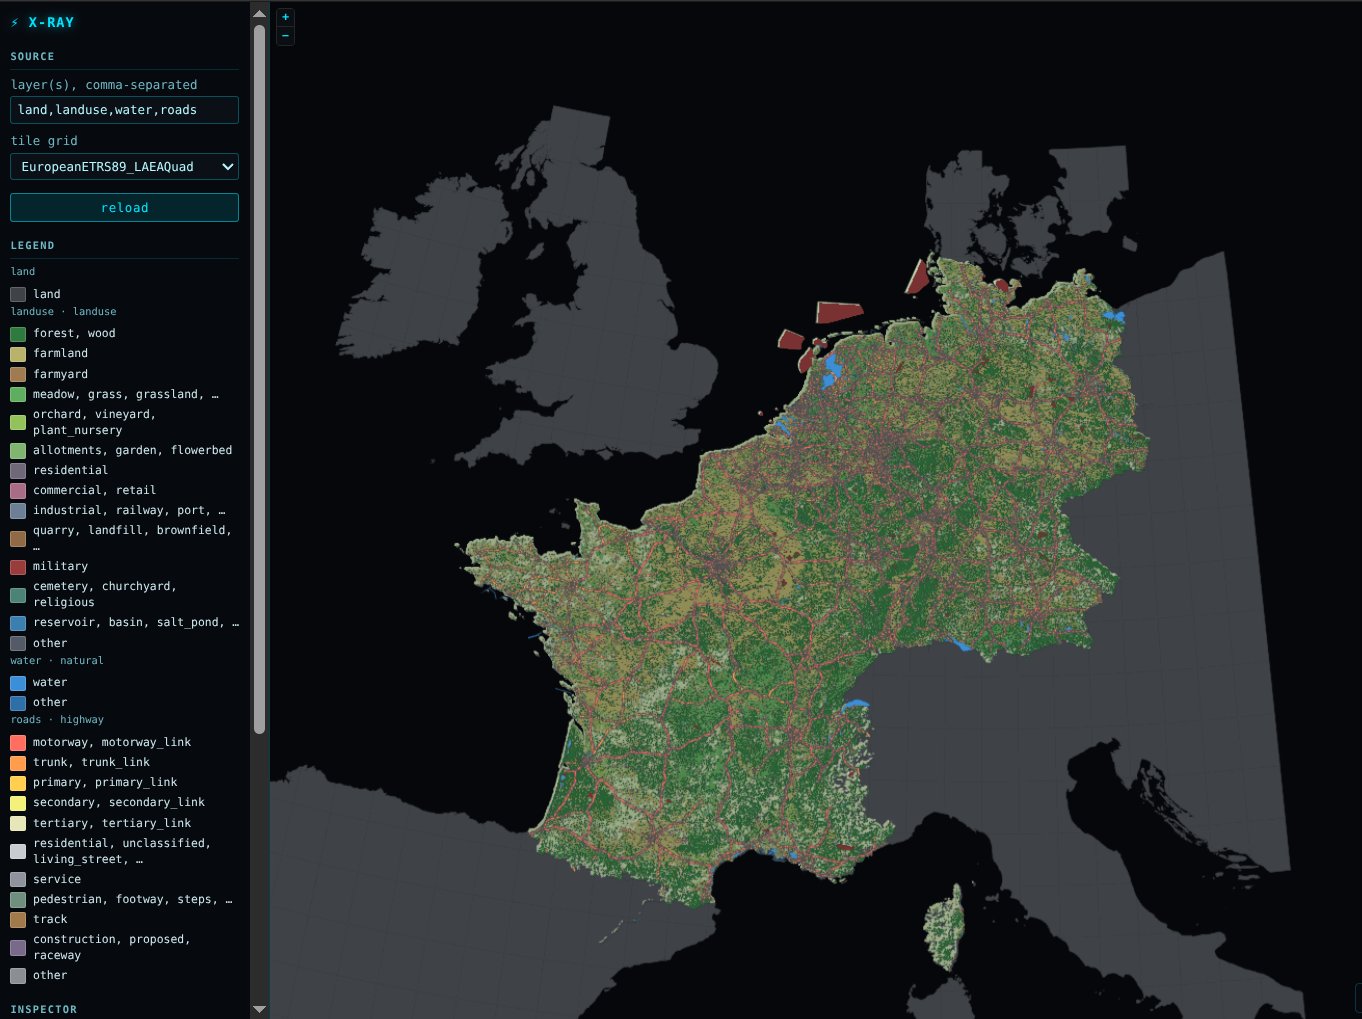
154.8 million features, live
Five countries queried live out of a 63 GB PostGIS database, on the EU's own grid (EuropeanETRS89_LAEAQuad, EPSG:3035) instead of Web Mercator. Precomputed where it's fast, live where it has to be.
See how it works ->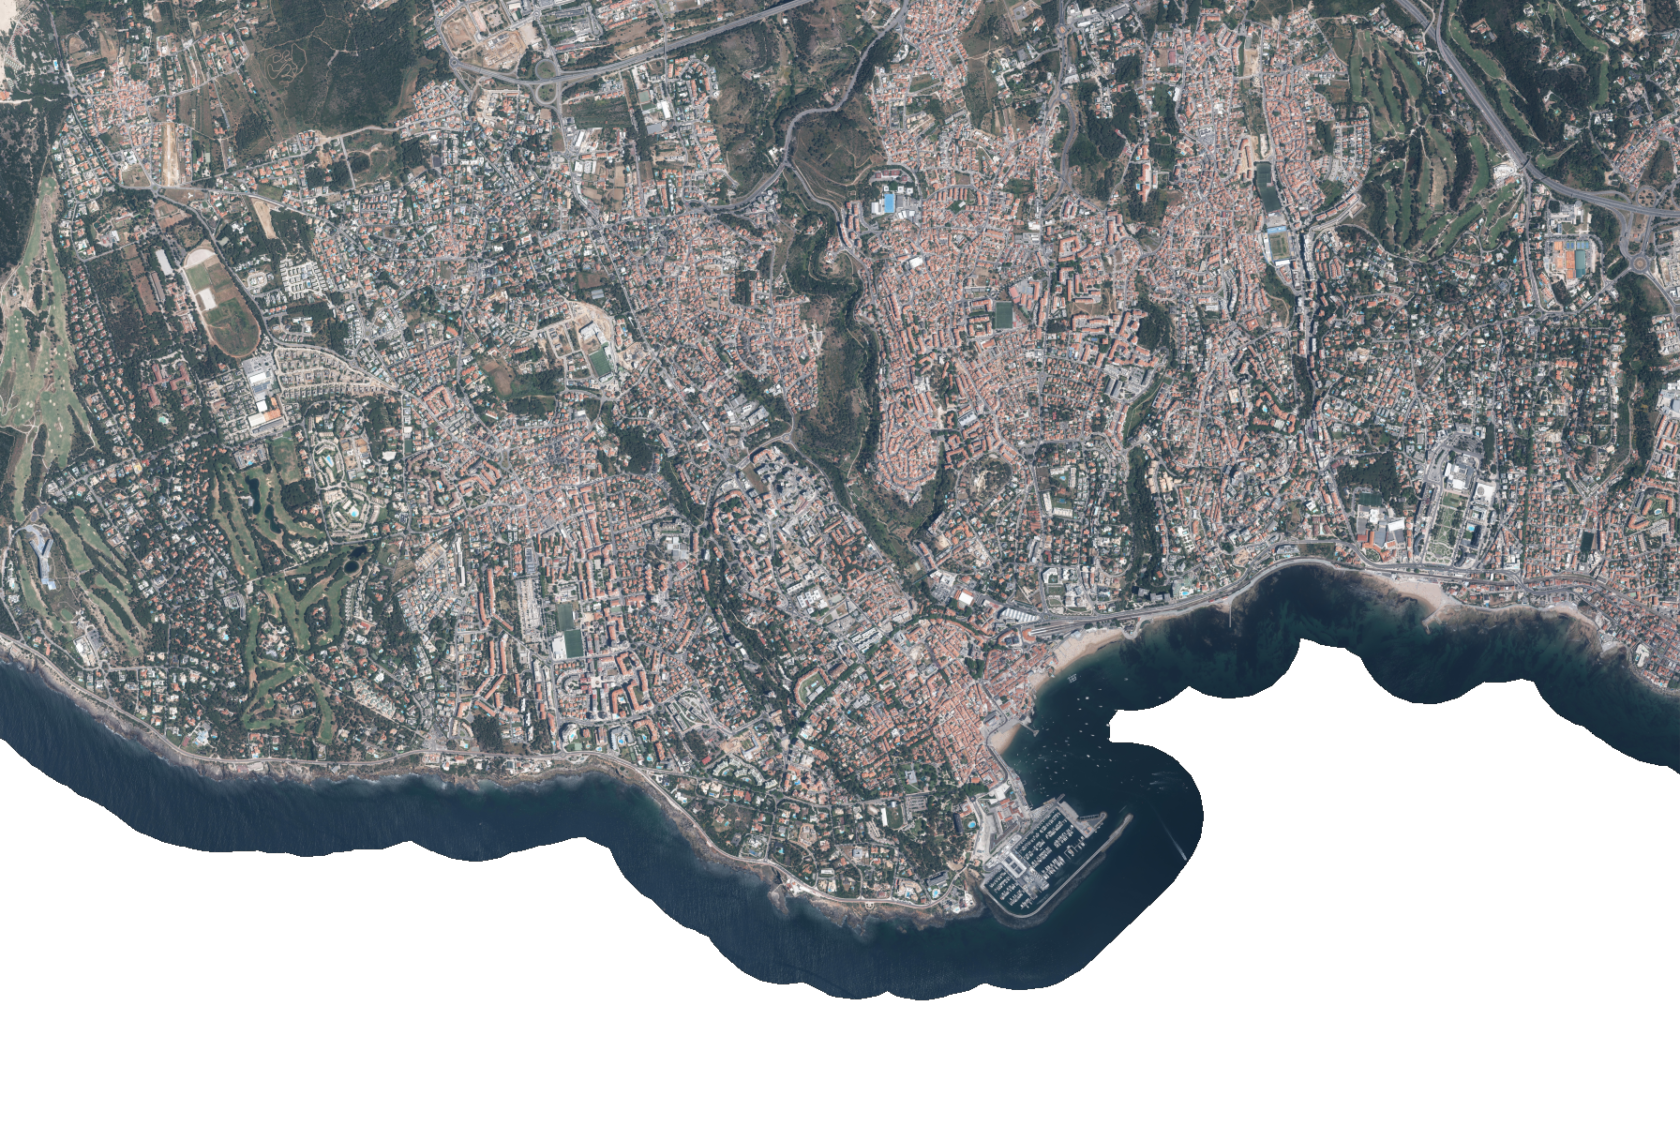
Also a library not just a server
No server at all this time: render_png()
is the same engine as a plain Python call, byte-identical to the CLI, GIL released
for real parallelism. A v0.3.6 preview: raster only, vector and NDVI are next.