Vector tiles · any grid
Switzerland, on its own national grid.
Almost every vector-tile server speaks one projection: Web Mercator, the grid of the whole web map world. This demo serves the same OpenStreetMap tiles on the Swiss national grid instead: SwissLV95CellSizes (EPSG:2056), the tile grid the Swiss e-government standard eCH-0056 defines, with swisstopo's own WMTS pyramid one click away in the grid picker. Same engine, same tiles, a grid most stacks simply can't do. It is also the most honest demo we have: getting a whole country into a browser has real limits, and this page is about running straight into them.
The approach
Any grid, and precomputed on it.
A grid described in one file
TerraServe serves the same vector tiles on any tile grid: the four built-in ones (Web Mercator, geographic, and the two polar grids) or a custom one you hand it as a single OGC TileMatrixSet JSON. Here that file is the Swiss national grid, and the engine had never seen it before. No code, no plugin, just the file.
Fast tiles on a grid nobody bakes for
Pre-baking tiles used to be a Mercator-only trick. Now the offline baker takes the same grid file, so a Swiss-grid layer gets the same treatment a Web-Mercator one always had: a whole-country tile becomes a 35 ms read off disk instead of a 1.2 s live render. That is the actual capability on show here.
Fast server, not a magic browser
Here is the catch, and we would rather say it than hide it. Precompute makes the server instant. It does nothing for your browser, which still has to download and hold every shape. A whole country in full detail is gigabytes of geometry in one tab. That is the interesting problem, and the rest of this page is how we deal with it.
The honest part
A whole country froze the tab at 5.8 GB.
The land-cover polygons are detailed: each tile of the country at overview zoom is about 2.5 MB, and roughly eighteen of them fill the screen. That is around 45 MB of shapes for the browser to decode and keep, and in testing it climbed to 5.8 GB and locked up. The precomputed archive served all of it in milliseconds. The browser still could not hold it.
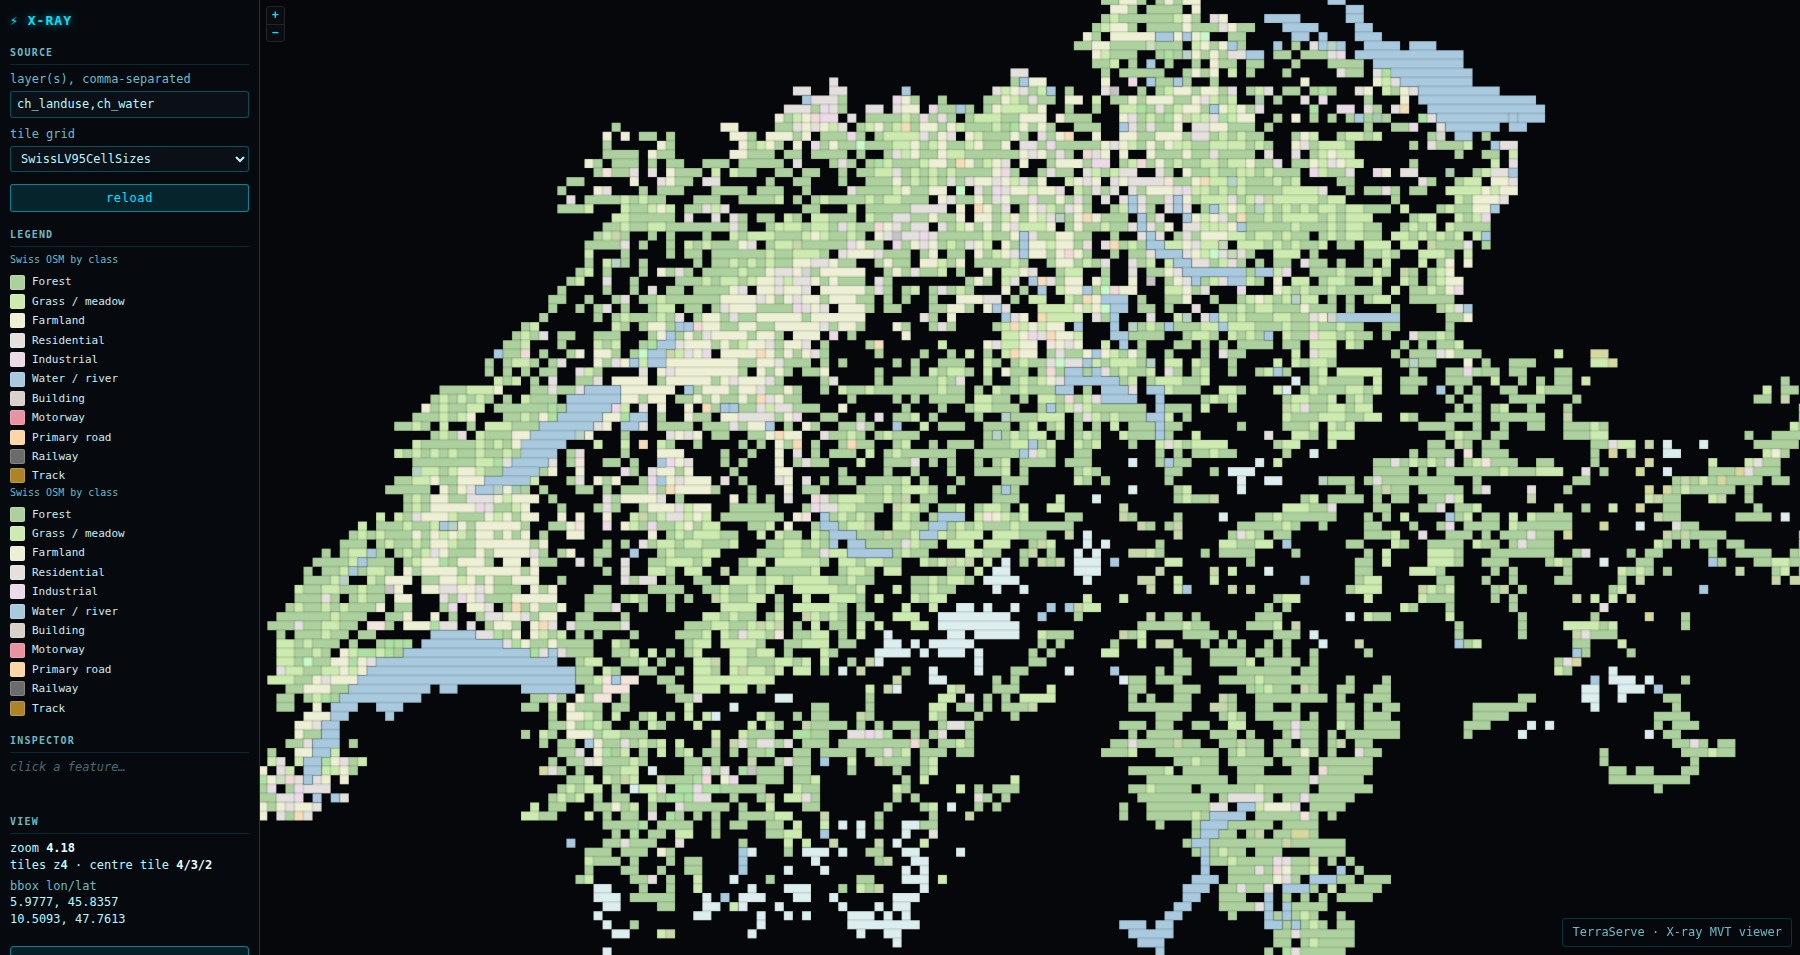
The reflex fix, dropping small shapes, did nothing: this is a handful of large polygons with very detailed edges, not many small ones. Simplifying the outlines only halved the size. What worked was a dominant-class mosaic: at low zoom, replace the polygons with a coarse grid of cells, each coloured by the class that covers it. That is 145× lighter, and it is the blocky pixel-art you see when the whole country is on screen. It is honest about what it is: a pattern, not every parcel.
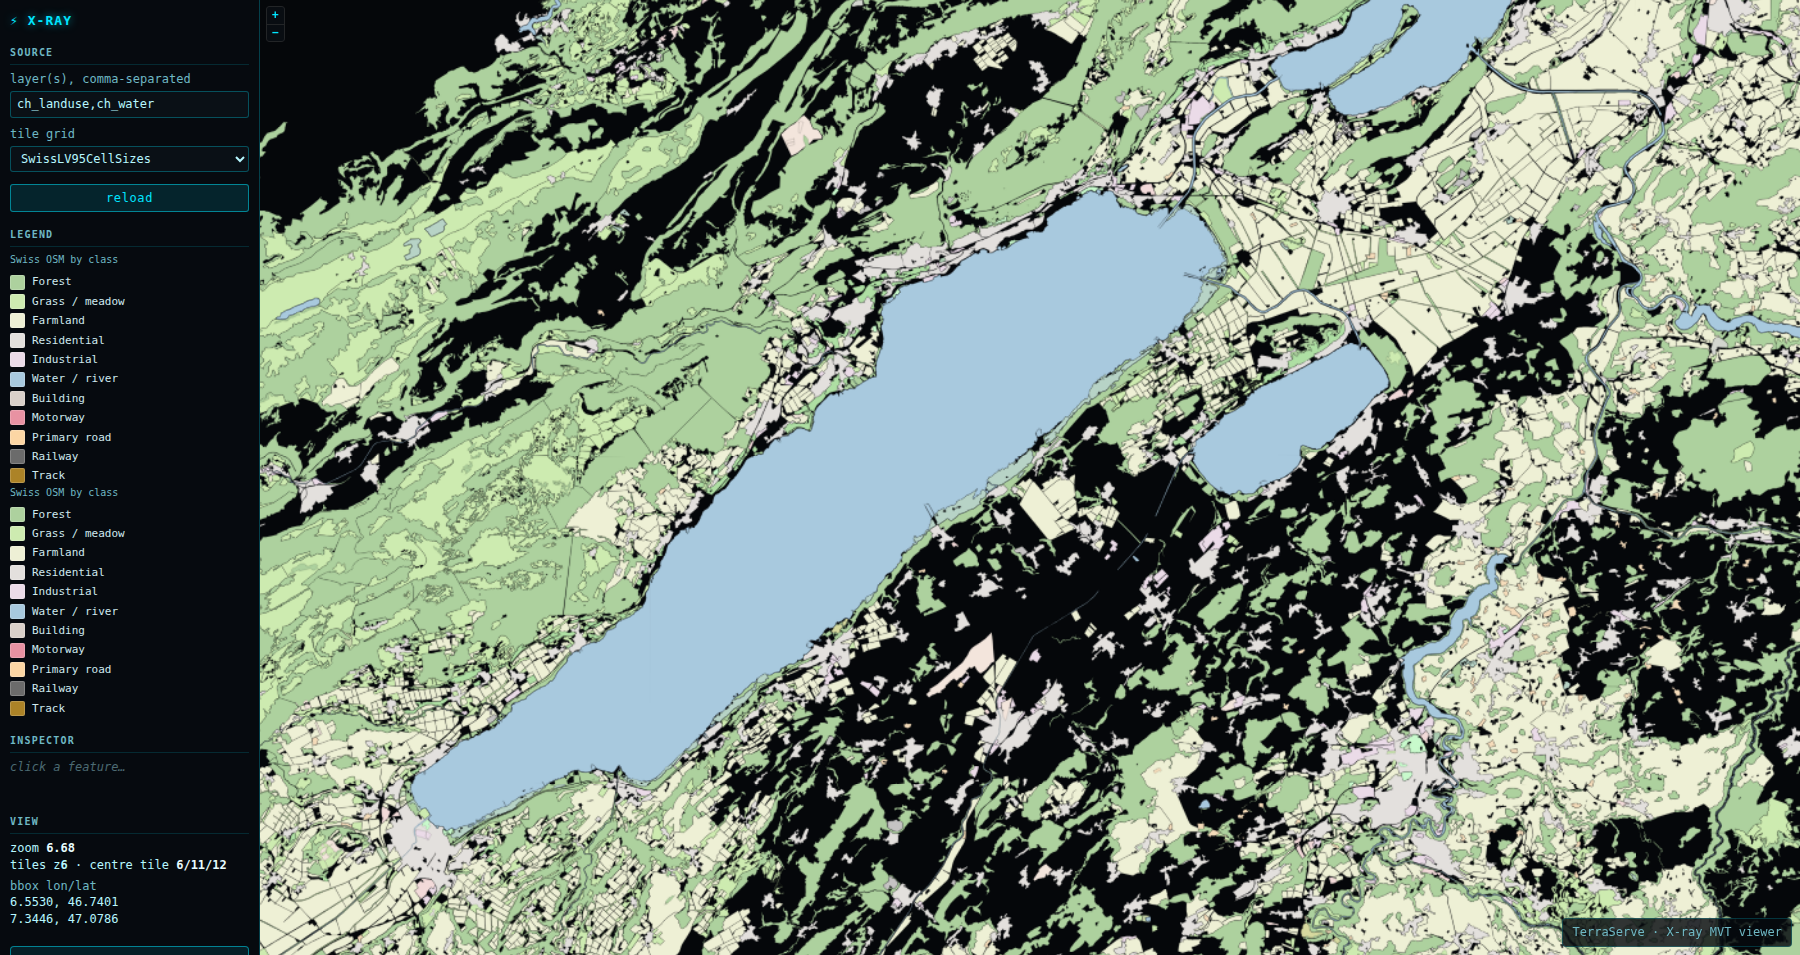
Then you zoom in, and the real shapes come back, because the close-up zoom levels are served live at full detail:
Why you might see a few tile errors
Web Mercator tiles the entire planet as a neat square that doubles every zoom. A national grid does not: the Swiss grid's overview level is 8 × 5 tiles, clipped to the country, not a full square. A viewer written for the square world asks for a few tiles past that edge, out in the empty black area beyond Switzerland, and the server answers "no such tile". They are harmless, they hold no data, and they are a real property of national grids, not a fault.
Pick either Swiss grid, not Mercator
The picker offers both Swiss grids, the eCH-0056 one the demo opens on and swisstopo's swissLV95, and each has its own light precomputed mosaic. Switch to Web Mercator and the browser would try to draw the country at full detail again, and hit the same wall. So this demo stays on the Swiss grids, which is the whole point of it anyway.
How it's served
The exact command.
The live demo runs this command. Every flag, explained below.
terraserve serve # Swiss OSM land cover on the Swiss national grids
  --config /data/swiss-local.yaml          # 7 layers, each on SwissLV95CellSizes (eCH-0056) and swissLV95
  --mvt-style /data/swiss.mvt-style.json  --font /data/DejaVuSans.ttf
  --mvt-min-feature-px 10  --raster-min-feature-px 0.05
  --mvt-cache 512  --max-inflight 8
  --tile-max-age 3600  --tile-encoding br
| --config swiss.yaml | The layer list: which OpenStreetMap themes to serve (here just landuse and water), where each file lives, and, for each one, the grid it publishes on. |
| grids: [eCH-0056_SwissLV95CellSizes.json, swissLV95.json] | Two Swiss national grids for EPSG:2056, each written out as one OGC TileMatrixSet JSON file: SwissLV95CellSizes, the grid the Swiss e-government standard eCH-0056 defines (the one the demo opens on), and swissLV95, swisstopo's own WMTS pyramid. A file is all it takes to serve tiles on a grid the engine has never seen. No code, no build. |
| --grid eCH-0056_SwissLV95CellSizes.json | The same grid file, handed to the offline tile baker. build-pmtiles used to only know Web Mercator; now it bakes a pyramid on any grid, so a non-Mercator layer gets the same fast pre-baked tiles a Mercator one always had. Each archive records the grid it was baked on, so one layer can carry one per grid. |
| --mvt-cell-px 8 --mvt-cell-field fclass | The mosaic. When zoomed out, replace the polygons with a coarse grid of cells, each coloured by its dominant class. It's about 145× lighter, which is the whole difference between a browser that loads the country and one that freezes on it (more below). |
| pmtiles: [ch_landuse.ech.zstd.pmtiles, ...] | The baked archives, one per grid. An overview tile is a read off disk instead of a live render: on the server, 9 ms for an eCH overview tile of about 2.5 KB. The whole eCH landuse pyramid, all five overview levels, is 37 KB. |
| --mvt-min-feature-px 10 | Skip shapes smaller than 10 pixels at the zoom you're at. It helps most datasets a lot; it did almost nothing here, and that turned out to be the key clue (again, below). |
Why eCH-0056. Until 0.3.6 this demo ran on swisstopo's WMTS pyramid alone. A Swiss user pointed out that the e-government standard eCH-0056 defines its own tile grid for EPSG:2056 (issue #21): 16 levels from 4000 m to 5 cm, mostly halving, and not aligned with swisstopo's tiles. Loading it turned up a typo in the published file: level 5 (100 m) declares 3 rows where 13 are needed, so served as published, most of Switzerland answers "out of range" at that zoom. The copy TerraServe ships corrects that one number, and since 0.3.6 the engine warns at startup when any grid file has a level like that.
Brotli on the wire, zstd on disk. Since 0.3.3 live tiles go out as brotli (--tile-encoding br, measured smaller than gzip and faster to produce), and the pre-baked archives store their tiles as zstd (--tile-compression zstd; an existing archive converts with terraserve pmtiles-recompress, every tile checked identical). A browser that accepts zstd gets the archive bytes straight off disk; one that does not, such as Safari, gets a brotli copy made once and cached; anything else gets gzip.
Measured on the live server when the archive was first baked (July, on swissLV95): a whole-country overview tile came back in about 35 ms from the baked archive, versus roughly 1.2 s to render it live, and the overview mosaic dropped the whole country to about 360 KB of tiles, from the 45 MB that froze the browser. The eCH archives are smaller still. Zoom past the overview and tiles are rendered live at full detail, small enough per tile that the browser is comfortable again.
Source & attribution. Land cover: OpenStreetMap, Switzerland extract via Geofabrik, © OpenStreetMap contributors, ODbL. Tile grids (EPSG:2056, written as OGC TileMatrixSets): SwissLV95CellSizes from the eCH-0056 standard, and the swisstopo LV95 WMTS pyramid.