Soil profiles · points
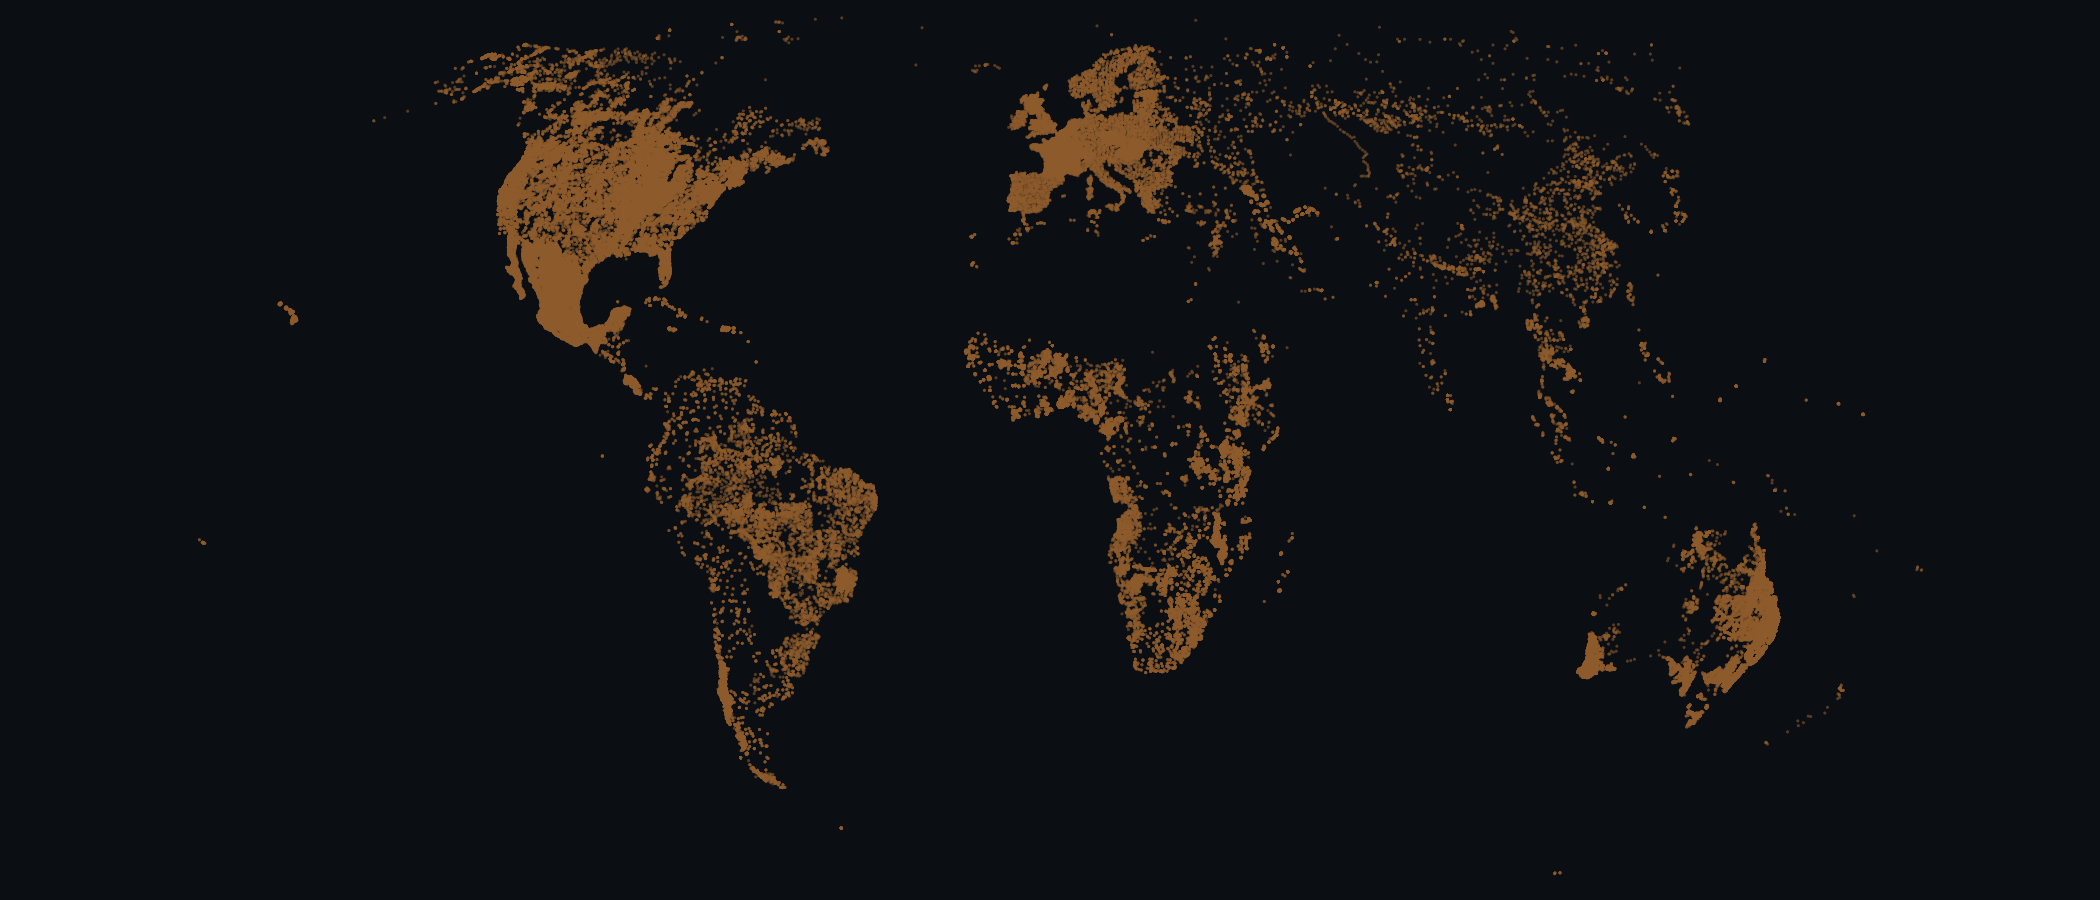
Where the world's soils were sampled: 228,090 points.
Every dot is a place where someone dug a soil profile and described it, shared by data providers around the world and brought together by ISRIC - World Soil Information in WoSIS, the World Soil Information Service.
This demo shows only where the profiles are, one brown dot each on an equal-area map; the soil property data that WoSIS holds is not part of it.
On 4 September 2026 the UN General Assembly adopted the resolution "Correct the Map", which encourages governments, schools and digital platforms to use equal-area projections such as Equal Earth. This demo is one way to put that into practice: the projection is a single grid file, and the server draws every tile and every map on it.
The approach
One file, nothing baked.
No archive to build
The dense demos pre-bake their zoomed-out views, because a tile that touches millions of shapes is slow to draw. A quarter of a million points is not that problem. Every tile and every map here is drawn on request from the one FlatGeoBuf: the slowest response measured, uncached, was the whole-world map over WMS at 0.21 s, and a tile over a city takes about 0.01 s. After that it comes from the cache.
An equal-area map, from one grid file
The demo opens on Equal Earth, an equal-area projection of the whole world. On most web maps Europe and Canada look more thinly sampled than they are; on Equal Earth the same number of profiles per square km gives the same density of dots on the screen.
The same brown dot, written twice
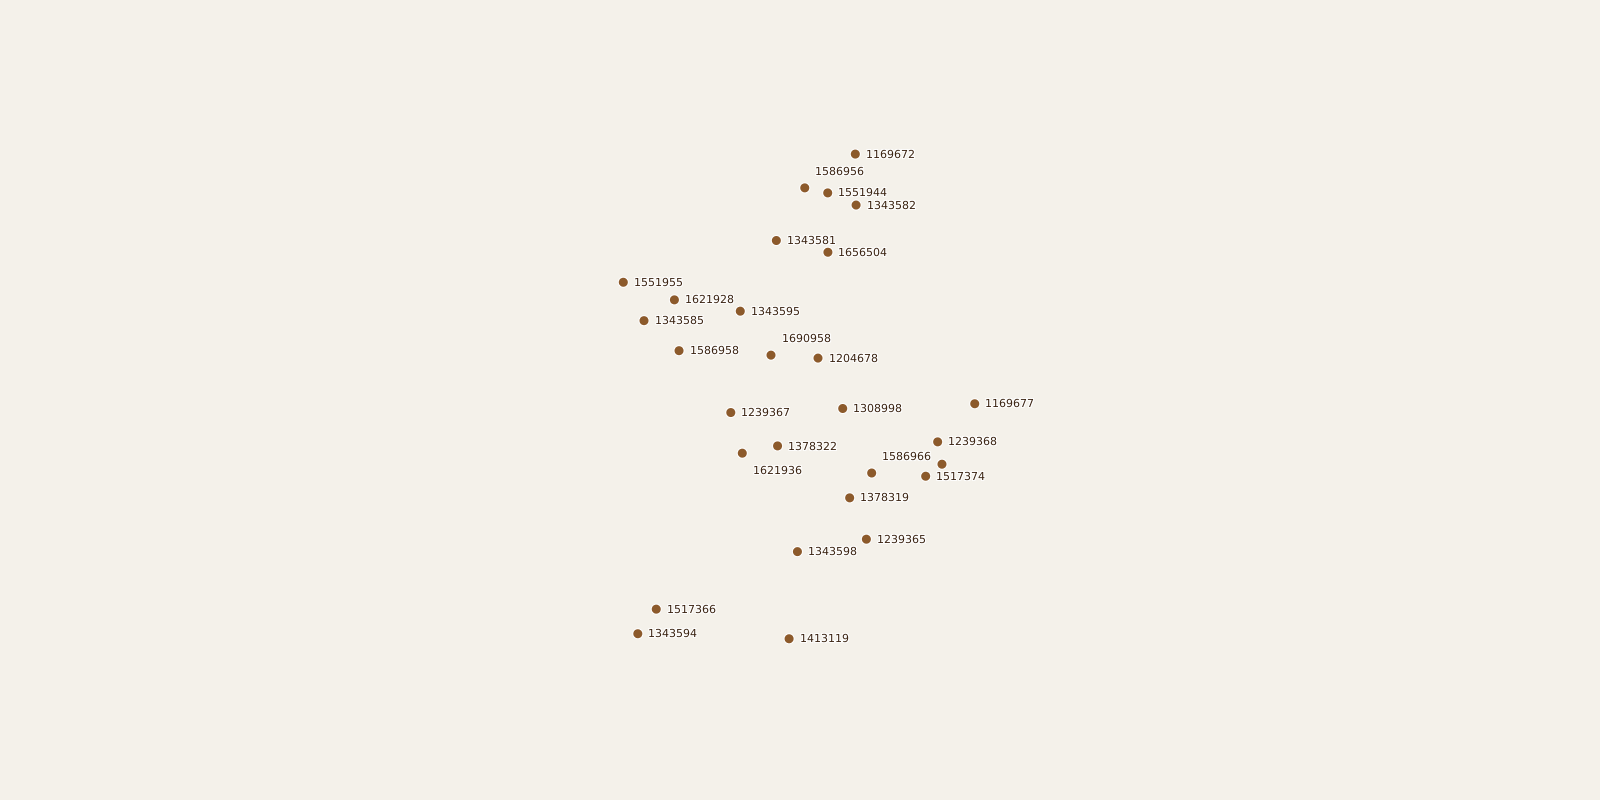
WoSIS is a compilation: soil profile data shared by many data providers, standardised and quality-assessed by ISRIC, and it keeps growing. The December 2023 snapshot used here holds 72 datasets. Every profile is the same brown dot: small and see-through for the whole world, bigger as you zoom in, and from about 1:150,000 with its profile number beside it. The same style is written twice: as an SLD for the pictures a GIS client asks for, which carry the numbers, and as a small style for the vector tiles the browser draws, which show the dots alone.
The patterns are the surveys
Zoom in and each country shows how it sampled: a regular grid across France, a dense cloud over Switzerland, scattered points where only global compilations reach. Those are properties of the data, not of the tiles.
How it's served
The exact command.
The real command behind the live demo.
terraserve serve # 228,090 soil profiles, worldwide points
  --vector /data/wosis/wosis_profiles.fgb
  --vec-style /data/wosis/wosis.sld  --name wosis
  --mvt-style /data/wosis/wosis.mvt-style.json
  --tms-grid /data/wosis/WorldEqualEarthQuad.json  # the grid the viewer opens on
  --tms-grid WorldCRS84Quad  --tms-tile-px 256
  --mvt-max-features 1000
  --mvt-cache 512  --wms-cache 512  --max-inflight 8
  --tile-max-age 3600  --tile-encoding br
  --public-url https://terraserve.io/demo/wosis/wms
| --vector | The data file: a FlatGeoBuf of 228,090 points, one per soil profile, with its built-in spatial index. Three columns only: profile_id, dataset_code, country_name. |
| --vec-style | How to draw the points: an SLD style with three scale bands (small dots, bigger dots, then dots with their profile_id label from about level 11 of the grid). |
| --name | What the layer is called: wosis, in the WMS, the tile endpoints and the viewer URL alike. |
| --mvt-style | The matching style for the vector-tile view a browser draws itself: the same brown, a dot size and a one-line legend. |
| --tms-grid WorldEqualEarthQuad.json --tms-grid WorldCRS84Quad --tms-tile-px 256 | Publish two tile grids for the WMTS and TMS endpoints, so the viewer can draw every point as a picture underneath the vector tiles. The first one listed is the grid the viewer opens on: Equal Earth (EPSG:8857), an equal-area projection of the whole world, given as one OGC TileMatrixSet JSON file. On an equal-area map the same number of profiles per square kilometre gives the same density of dots on screen, at any latitude. WMS answers in the same projection, because a layer accepts the CRS of every grid it publishes. The WGS84 grid stays in the grid picker. |
| --mvt-max-features 1000 | A vector tile with more than 1,000 profiles carries a sample of at most 1,000 instead. The default is 20,000, and at that size a browser drawing the tiles itself froze on the world view up to 0.3.6: the viewer built a style for every single point on every frame. 0.3.7 fixed that; the cap stays so each of the two world tiles is about 10 KB instead of 123 to 147 KB. From level 13 no tile is over the cap, and the picture underneath always has every point. |
| --mvt-cache 512 | Remember recently-drawn vector tiles (up to 512 MB), so a revisit is free. |
| --wms-cache 512 | Same idea for the picture (WMS) view. A repeated world view comes back in under a millisecond. |
| --max-inflight 8 | Draw at most 8 tiles at once, one per core, so a busy moment can't blow up memory. |
| --tile-max-age 3600 | Every tile carries an ETag and answers a revisit with a 304; this adds an hour of browser caching, so a revisit costs no request at all. |
| --tile-encoding br | Send vector tiles as brotli. A browser that does not accept brotli still gets gzip. |
| --public-url | The public address to advertise to GIS clients, since it runs behind a web proxy. |
| TERRASERVE_FGB_MAX_QUERY_FEATURES | An environment setting, not a flag: the most points one request may read. The default (500,000) already covers all 228,090; the demo sets 1,000,000 so a larger future snapshot is never cut short. |
Measured, uncached, on a workstation: each of the two whole-world vector tiles is about 10 KB compressed, in 0.13 s; a whole-world picture tile takes 0.19 s; a 2048 px world map over WMS takes 0.21 s, and a close-up with profile numbers 0.01 s. A vector tile holds at most 1,000 points, so the widest views show a sample and every point appears as you zoom in. The picture layer underneath, on by default in the demo, always draws every point.
Source & attribution. WoSIS, snapshot December 2023, ISRIC - World Soil Information, CC BY 4.0. Batjes NH, Calisto L and de Sousa LM, 2024. Providing quality-assessed and standardised soil data to support global mapping and modelling (WoSIS snapshot 2023). Earth System Science Data, doi:10.5194/essd-16-4735-2024. The extract and the idea for this example came from issue #23.
In action
From the whole world down to one profile.