OGC WMS/WMTS/TMS · live PostGIS
Five countries, one live database, the EU's own grid.
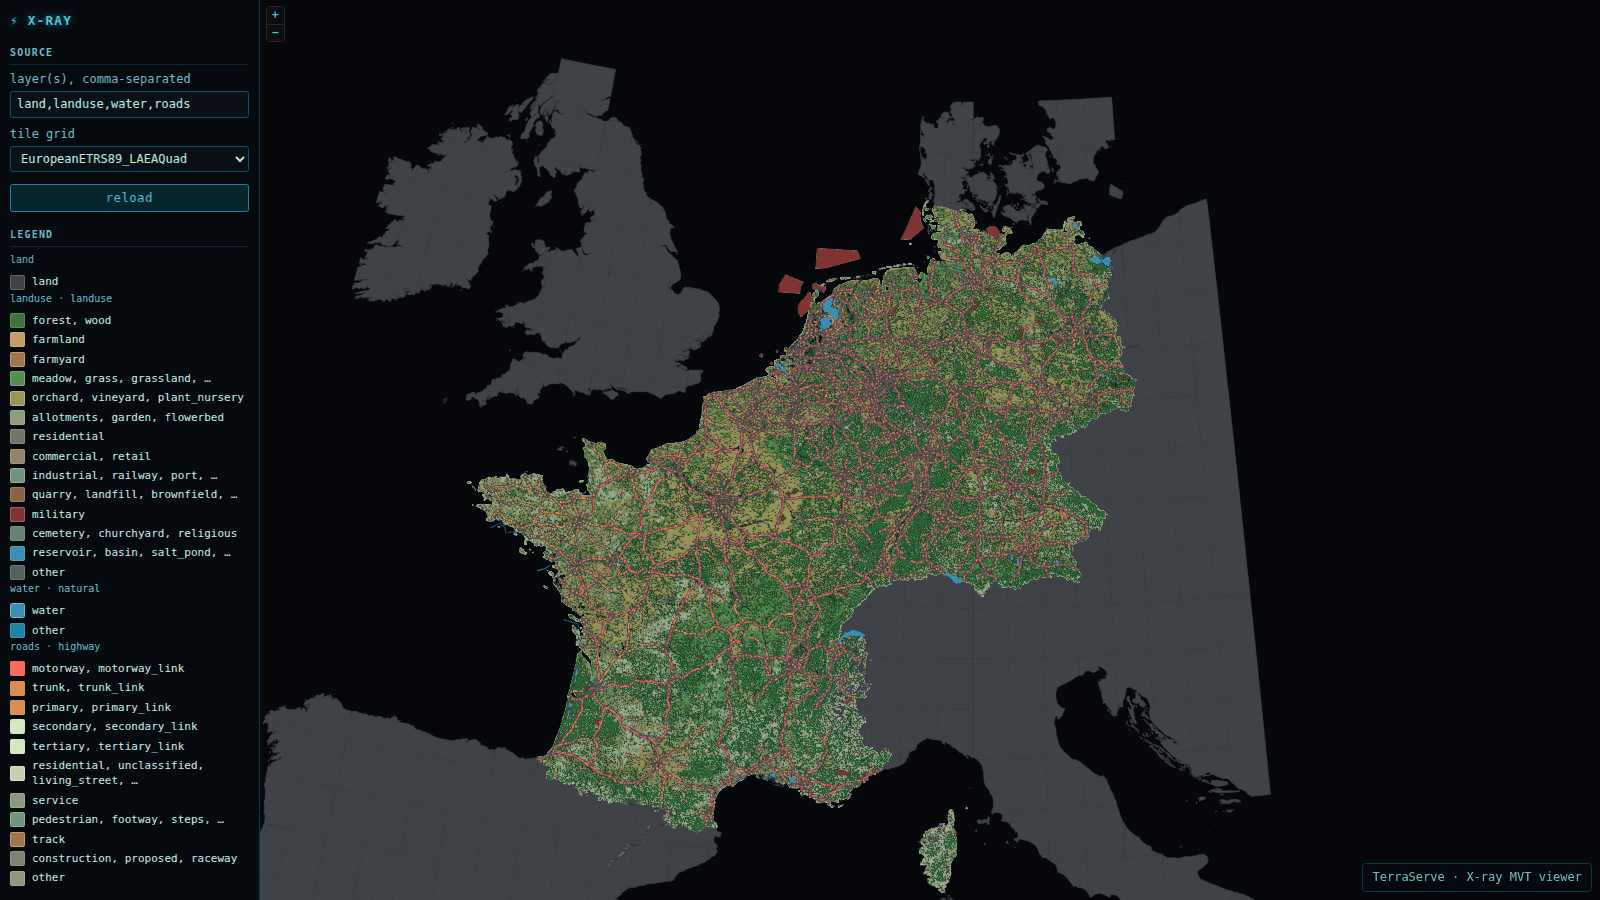
Every other demo here reads a file. This one reads a database: a 63 GB PostGIS table holding 154.8 million OpenStreetMap features across Germany, France, the Netherlands, Belgium and Luxembourg, queried live, per tile. It also runs on the grid the EU itself publishes for pan-European data, EuropeanETRS89_LAEAQuad (EPSG:3035, INSPIRE's own equal-area grid), not Web Mercator. The zoom levels most people actually browse are precomputed archives, read in about a millisecond; zoom in past them and you're watching a live spatial query answer instead. Six layers: a land base under landuse, water, roads, buildings and places, each themed and legended from one style file.
The approach
A live database with the archive's speed.
Not Web Mercator: EuropeanETRS89_LAEAQuad
The swiss demo proved TerraServe can serve any tile grid. This one does it at EU scale, on the grid INSPIRE actually specifies for pan-European datasets: EPSG:3035, a Lambert azimuthal equal-area projection with its own origin and cell sizes, published as one OGC TileMatrixSet document the viewer reads directly, so raster and vector tiles can't drift out of registration with each other.
107.9 million buildings, queried per tile
Every other example on this site opens a file. This one queries PostGIS: for a given tile, only the rows inside that tile's bbox are ever fetched, so a request for one Frankfurt block never touches the other 154.7 million features. The same windowed-read discipline as the vida demo, just against a live relational database instead of a flat file.
z0-10 is a read, not a query
The zoom range most visitors actually use, continent down to city, is pre-baked to tile archives for all six layers, as vector tiles and, for the OSM layers, as ready-made raster images too. A z9 tile from the archive has measured at about 1.1 ms. The overview zooms are not plain cuts of the data: landuse z0-7 is a dominant-class mosaic, roads are joined into whole lines per class band, and water keeps its rivers while dropping ponds smaller than half a pixel, for the reasons in the next two sections. Zoom in past z10 and PostGIS answers directly, live, still scoped to just the tile in view.
Making the overview browsable
Three things a size gate cannot do.
Every tile server thins its overview zooms with a size gate: skip what is smaller than some fraction of a pixel. On a continent of field-by-field farmland and intersection-by-intersection roads that one tool is not enough, and each of the three fixes below was found by measuring the archive, not by looking at the map.
Farmland is mapped field by field
At this grid's zoom 3 a 2 px gate keeps 26 % of the landuse area, because a French field is far below 2 px and no gate keeps what it cannot see. The overview zooms of the landuse layer (z0-7) are now a 1 px dominant-class cell mosaic: every display pixel votes for the class that covers most of it, rows are run-length merged, and the tile is a few hundred KB whatever the polygon count. z3 went from 3.14 MB to 684 KB, z6 from 286 MB to 30 MB and z7 from 438 MB to 91 MB, hole-free wherever OSM has data.
The per-tile cap was the seam
Roads are lines, and a line has no area, so an area gate never thins them; only the per-tile cap bounded a roads tile, and a cap that binds cuts the data at an arbitrary row. The signature is measurable: the five heaviest z7 tiles sat within 1.05× of each other. The fix is the one imposm3 and OpenMapTiles use, a class-filtered view per zoom band: motorways and trunks to z4, primary and secondary to z6, tertiary to z8, residential and unclassified at z9, everything from z10. z7 went from 663 MB to 80 MB, z8 from 799 MB to 94 MB, z9 from 907 MB to 331 MB, and the spread opened to 1.40×.
What is left black is not in OSM
After the mosaic, some areas stayed black. Measured on one 5,703 km² view in eastern France, 91 % of the area has a landuse polygon and natural=* adds only 2.5 %: the rest is simply unmapped. No rebake of OSM data can fill that, so a land base layer now sits under everything, cut from the OSM land polygons: 32 MB for the whole z0-10 pyramid, one neutral colour, and unmapped land reads as land while the sea stays dark.
One more number from the same week: the same 871 KB tile takes 13 ms on the server and 11.2 s to reach a browser in Japan, so the opening view moved from zoom 9 to zoom 3 and the host runs BBR. The slow part of a tile server is rarely the server.
Keeping the browser alive
The tab crashed on features nobody could see.
Opening the demo and zooming in twice took the browser tab down, three runs out of three. Tile sizes were fine; the problem was how many features a browser has to decode and keep. Counted in the viewer itself, a 1600×900 view at zoom 5 held 1.96 million features and a 3.2 GB JavaScript heap: roads 1.01 million, landuse 666,000, water 283,000. Almost all of them were smaller than a pixel. Swapping the map library would not have helped: measured the same week, OpenLayers' WebGL renderer used 1.4 to 2.2× more memory, because the GPU buffers come on top of the decoded features. So each layer was fixed in its own data, in its own grid.
Keep the rivers, drop the dust
A z4 tile carried 27,785 water polygons, 88 % under a pixel, because one subset cut for z6 served every zoom from 0 to 6. A plain half-pixel area gate cut it to 371, and broke every river into dashes: OSM stores a river as many polygon pieces, each too small on its own. The fix is a PostGIS view per zoom that keeps every water=river and canal piece plus any other water of at least half a pixel. The same tile: 3,227 polygons, rivers intact. Across the archive, z5 went from 716,076 features to 62,560.
Join the pieces, lose nothing
OSM splits a road at every junction, so a z5 tile over Frankfurt held 78,542 pieces with a median length of 0.19 px. Dropping short pieces punches holes in motorways; joining them does not move a pixel. ST_LineMerge per class, only through points where exactly two pieces meet, turned 204,541 motorway and trunk pieces into 7,654 lines, and 1.89 million overview pieces into 451,000. Slip roads, a dot at these scales, are left for z7 and up. Archive-wide: z4 282,000 -> 8,000 features, z5 1.85 million -> 405,000.
A coarser mosaic, where it holds up
The landuse mosaic writes one square per pixel, about 35,000 per tile. At z5 and z6 the cells are now 2 px: same classes and colours, 3.4× fewer features, softer edges you have to look for. At z4 the same change showed a fine striped texture over farmland, so z4 kept its 1 px cells. The idea of dropping vector landuse at low zoom and leaning on the raster underlay died on a screenshot: underneath the land base, the underlay is not the class-coloured map a visitor expects.
| opening view, zoomed in twice, 3 runs | peak tab + GPU memory | JS heap at zoom 5 | crashed |
|---|---|---|---|
| before | 4,857 MiB | 3.2 GB | 3 of 3 |
| after | 2,495 MiB | 2.1 GB with water and roads alone | 0 of 3 |
Headless Chromium on a real GPU, OpenLayers 9.2.4, the same page before and after: only the archives changed. None of it needed an engine change, and none of it left the EU grid. The next limit is known too: Frankfurt at zoom 9 with buildings on still reaches a 3.3 GB heap.
The zoom plan
What each archived zoom actually reads.
A LAEA pixel is not a Web Mercator pixel: at 50° N one zoom on this grid is worth about two and a half Mercator zooms, so "z7" here already shows tertiary roads. Every band below was sized by counting candidates in SQL before baking; those counts predicted the finished archives to within half a percent.
Size gate
When a tile is encoded, a polygon smaller than N display pixels at that zoom is left out (--mvt-min-feature-px), measured on the whole feature so the gate itself opens no seams. A pixel quarters with every zoom in while features stay the same size: 0.03 px is 2,300 m² at z6, 140 m² at z8 and 9 m² at z10; 0.1 px at z3 is 48 hectares. So it is banded, off below z6 on the live path, and each archived band picks its own value or none. Lines and points have no area and are never thinned by it.
Cap
The most features one tile may carry, 150,000 here. A backstop, not a cartographic tool: when it binds, the tile is cut at an arbitrary row of the query and two neighbours disagree along their shared edge. Its signature is measurable, the five heaviest tiles of a zoom sitting within a few percent of each other. Every archived band is shaped so the cap never binds, and the bake passes the same number as the server.
Subset and cell mosaic
A subset is a GeoPackage cut once from the database with a band's gate applied, so a bake reads a small file and every tile of the band sees the same selection. A cell mosaic is what a coverage gets instead of a gate: every display pixel votes for the class that covers most of it, runs are merged along the row, and the tile is a few hundred KB whatever the polygon count, with no holes where the data has none.
| LAEA zoom | m / px | ≈ Mercator z at 50° N | what a visitor sees |
|---|---|---|---|
| z0 | 17,578 | 2.5 | the whole extent in one tile |
| z3 | 2,197 | 5.5 | the opening view |
| z7 | 137 | 9.5 | tertiary roads appear |
| z9 | 34 | 11.5 | residential roads appear |
| z10 | 17 | 12.5 | the last archived zoom; past it, PostGIS answers live per tile |
| layer | archived bands, z0-10 | past z10 |
|---|---|---|
| land | OSM land polygons, no gate: 32 MB for the whole pyramid, worst tile 97 KB | GeoPackage, windowed |
| landuse | z0-4 and z7 a 1 px dominant-class cell mosaic, z5-6 the same at 2 px; z8-10 gated polygons (0.1 px) | table, 0.03 px gate |
| water | z0-2 water of at least half a pixel; z3-5 every river and canal piece plus other water of at least half a pixel, a PostGIS view per zoom; z6 a GeoPackage subset; z7-10 the table, 0.03 px gate | table |
| roads | z0-4 motorway and trunk, z5-6 + primary and secondary, both joined into whole lines per class with slip roads left out; z7-8 + tertiary and slip roads; z9 + residential, unclassified, living_street, pedestrian; z10 everything | table |
| buildings | z0-6 a GeoPackage subset, ungated at z0-5; z7-10 the table, 0.03 px gate | table |
| places | z0-4 city and town; z5-7 + village, suburb, quarter, neighbourhood; z8-10 all | table |
Lines and points are exempt from an area gate (a line has no area, a point has neither), so for roads and places only the per-tile cap ever bounded a tile. Those two layers use a class-filtered PostGIS view or table per band instead, the imposm3 and OpenMapTiles pattern, and the overview road bands are merged in the database before they are baked; it needed no engine change, because a postgis:// URI is accepted as a zoom-band source.
The honest part
A 1-pixel gate erased every building at the edge of the map.
The buildings archive was baked with the same size gate every other layer uses: skip shapes smaller than a set number of pixels, so overview zooms aren't crowded with dust. At most zooms, on most datasets, that's invisible. At this grid's zoom 0, a pixel covers about 17.5 km on a side, so a gate of even a single pixel demands a building bigger than 309 km² to survive. No building on Earth clears that bar. The bake didn't thin the buildings layer at the shallowest zooms, it wrote zero tiles for it, silently, and a visitor who zoomed all the way out got a live query against 107.9 million rows instead, which is exactly the request that used to time out.
Fixed by re-baking buildings ungated for its full z0-10 range, the same choice its own raster archive had already made for the same reason. The lesson generalizes past this one layer: any threshold tuned for a comfortable middle zoom can silently produce nothing, not just less, at the far end of the range. Check the shallowest zoom explicitly, every time.
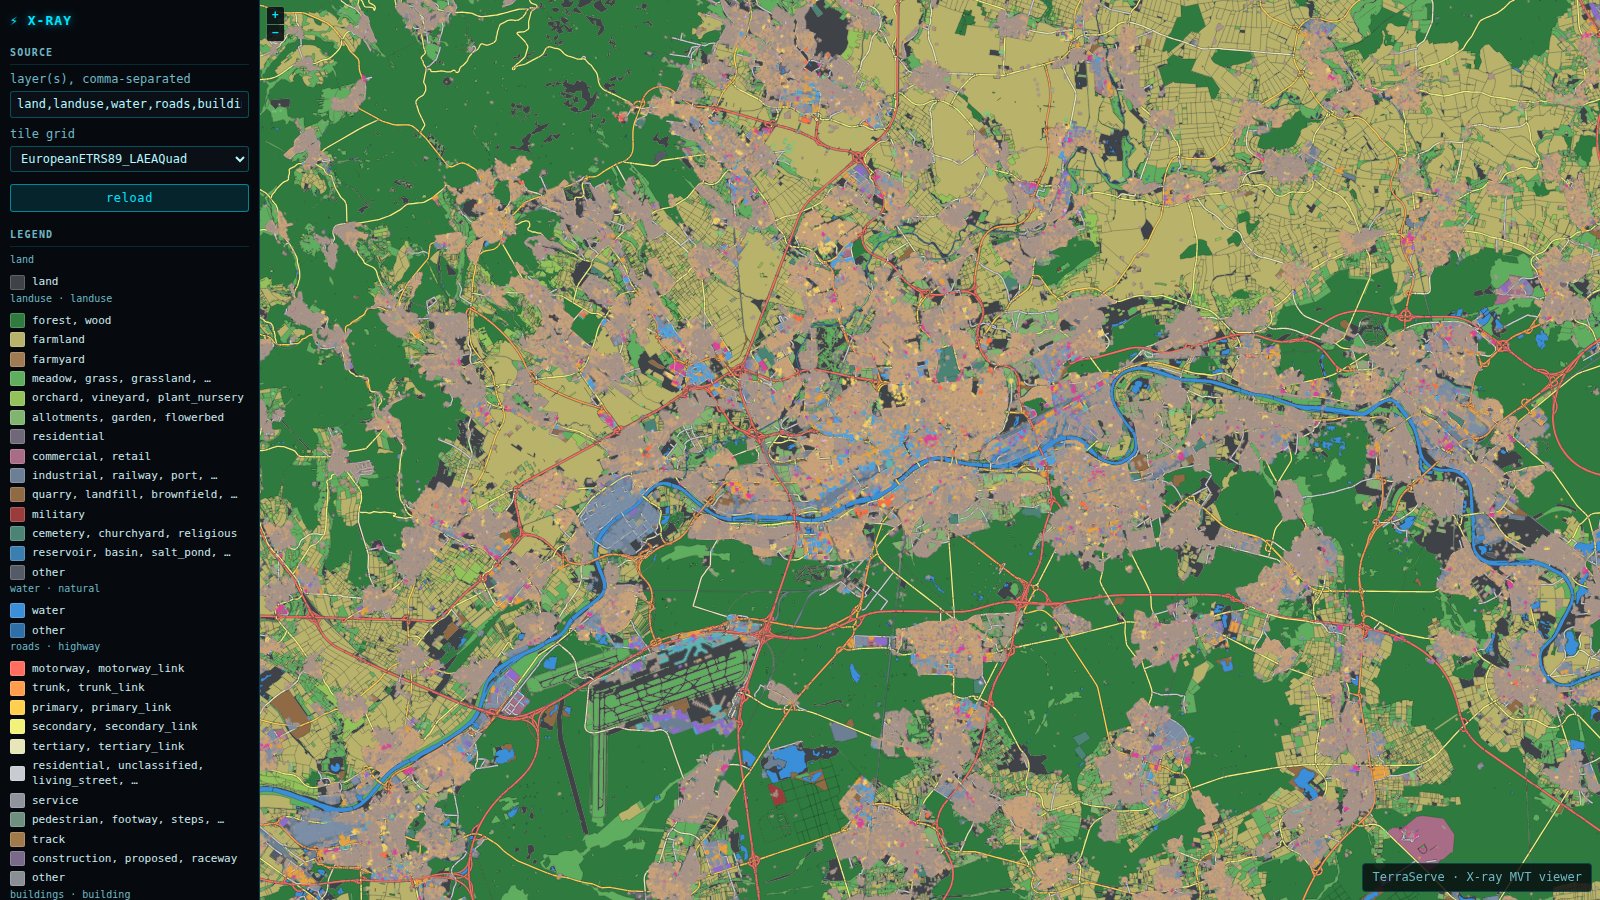
Every layer colour-coded from one file
Industrial, commercial, retail, warehouse, school and hospital each get their own colour from a single MapLibre style file. That file used to be global to the process, so the other layers fell through to a default colour; now each style layer is tagged with its source-layer, the server hands every layer only its own entries, and the viewer draws one legend section per layer: landuse by class, roads by highway class, places by rank.
Toggle the WMTS layer to see it
The X-ray viewer's raster underlay reads through /wmts, which serves the same z0-10 archive as the vector tiles, so switching it on costs nothing extra inside the archived range. Past z10 it renders live from PostGIS, same as the vector layer above it, so the two never fall out of sync.
How it's served
The exact command.
One process, six layers, one YAML config. Most of the flags below exist because of the lessons above.
terraserve serve # 154.8M OSM features, six layers, one config
  --config /data/eu5/eu5.yaml            # land, landuse, water, roads, buildings, places
  --mvt-style /data/eu5/eu5.mvt-style.json   # one file, per layer via source-layer
  --mvt-min-feature-px 0.03  --mvt-min-feature-px-min-zoom 6  # the live-path gate, banded
  --mvt-max-features 150000  --raster-min-feature-px 0.05
  --tile-max-age 3600   # ETag + 304 always; this adds Cache-Control
  --tile-encoding br    # live tiles as brotli; archives are zstd
  --mvt-cache 512  --wms-cache 512  --max-inflight 8
  --public-url https://terraserve.io/demo/eu5
| --config eu5.yaml | Six layers in one YAML file: a land base, then landuse, water, roads, buildings, places. Five read their own PostGIS table; the land base reads a GeoPackage. Each has its own grid list and its own precomputed archive paths. One process serves all six. |
| grids: [EuropeanETRS89_LAEAQuad.json] | The OGC-registered EU grid, EPSG:3035, written out as one TileMatrixSet JSON file, the same mechanism the swiss demo uses for its national grid, here at continental scale instead. |
| --mvt-style eu5.mvt-style.json | One MapLibre style file for all six layers. Each style layer carries a source-layer tag, so /mvt/{layer}/style.json serves every layer only its own entries: landuse by class, roads by highway class, buildings by use, places by rank, land in one neutral colour. The X-ray viewer themes each layer from its own entry and builds one legend section per layer. |
| --mvt-min-feature-px 0.03 --mvt-min-feature-px-min-zoom 6 | The cartographic gate for the live path, banded: off below zoom 6, then shapes under 0.03 px are skipped. A pixel-denominated gate quarters with every zoom in while feature sizes do not, so one global value cannot serve a z0-z10 pyramid: the 0.03 that is right at z8 blanks z3. The archives make their own per-zoom choices instead (the cards above). |
| --mvt-max-features 150000 | The per-tile cap. A cap that binds is a seam: the tile is cut at an arbitrary row, so two neighbours disagree along their shared edge. On this demo it is a backstop for the live path only; every archived zoom is shaped so the cap never binds. Its signature is measurable: the five heaviest roads tiles at z7 sat within 1.05× of each other while the cap bound, and spread to 1.40× once the class band replaced it. |
| --tile-max-age 3600 | Every tile carries a strong ETag and answers If-None-Match with a 304, so a revisit costs a few hundred bytes per tile instead of the tile. With a one-hour max-age a revisit inside the hour costs no request at all: measured from the traefik log, the opening view is 150 tile requests and 6.22 MB on the first load, zero on a reload. The price is that a rebake plus restart stays invisible to a returning browser for up to an hour. |
| --tile-encoding br | Live tiles (past z10) go out as brotli. The six vector archives store theirs as zstd, and each response is negotiated from what the browser accepts. |
| --raster-min-feature-px 0.05 | The safety gate for the raster path, deliberately about 40× smaller than the MVT one. Still bounds a worst-case request to 0.07 GiB instead of 52.6 GiB, without visibly thinning the map. |
| TERRASERVE_PG_STATEMENT_TIMEOUT_MS=90000 | Raised 3× from Postgres's own 30 s default, after a live request over nearly a whole country outlasted it. A safety margin for an occasional wide request, not a promise every bbox now succeeds. |
| TERRASERVE_PG_MAX_QUERY_FEATURES=150000000 | The correctness knob a table this large needs: the 500,000 default would silently truncate a 107.9-million-row table with no ORDER BY, so two identical requests could return different tiles. |
Brotli on the wire, zstd on disk. Since 0.3.3 live tiles go out as brotli (--tile-encoding br, measured smaller than gzip and faster to produce), and the pre-baked archive stores its tiles as zstd: the six vector archives went from 8.26 GB to 7.80 GB (buildings -6.9 %, roads -4.3 %, landuse -3.9 %, places -10.9 %), converted from gzip with terraserve pmtiles-recompress, every tile checked identical. A browser that accepts zstd gets the archive bytes straight off disk; one that does not, such as Safari, gets a brotli copy made once and cached; anything else gets gzip.
Measured on the live server: a z9 tile from the buildings archive returns in about 1.1 ms. Archive coverage across all six layers is gap-free from z0 to z10; the buildings archive originally shipped without z0/z1 at all, for the reason above, and that was found and fixed the same day it went live.
Source & attribution. OpenStreetMap data for Germany, France, the Netherlands, Belgium and Luxembourg, extracts via Geofabrik; the land base layer is cut from the OSM land polygons published by osmdata.openstreetmap.de. All © OpenStreetMap contributors, ODbL. Tile grid: EuropeanETRS89_LAEAQuad (EPSG:3035), the equal-area Lambert azimuthal grid the EU publishes for INSPIRE data, written as an OGC TileMatrixSet.